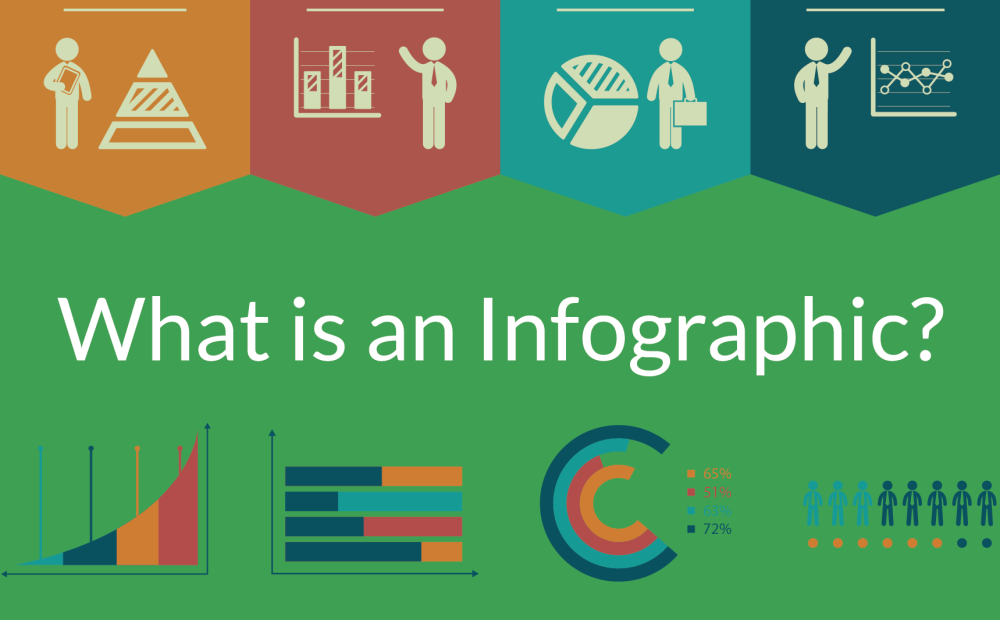
What is an infographic? A single infographic explains it all.
Conveying your ideas and message can sometimes be difficult without the right tools. Many times you spend a great deal of time gathering facts, writing up a large body of persuasive evidence, and releasing it into the world hoping your audience will read through the entire thing and absorb it. As an alternative to just using traditional white papers and articles, infographics are an effective way to convey complex information and drive the point home quickly in a way that your readers will remember.
An infographic is a powerful tool that combines statistics and data into beautiful, humorous, or easily digestible images that you can easily post to various platforms to ensure the information you want to instill in readers is getting across as intended.
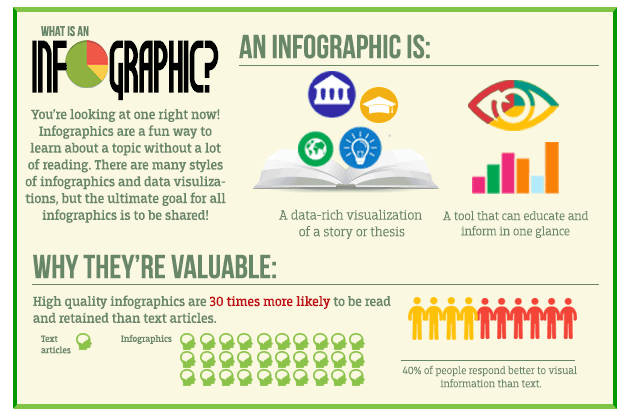
Studies show that infographics are 30 times more likely to be read than text articles, and 40 times more likely to be shared via social media. That greatly increases the chances that your message will get seen! Not only that, but 90% of information transmitted to the brain is visual, and is processed 60,000 faster than reading text. [Source]
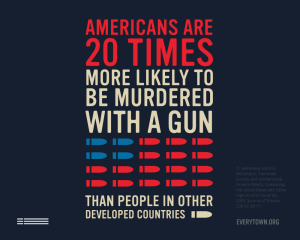
When you’re thinking about the impact that difference between reading and seeing information makes, imagine it as the difference between going to the Moon and going to Mars. To put it even more succinctly, reading comprehension moves about the speed of sound, versus visual comprehension at about the speed of light. When you’re message is important, you may only have one impression to gain attention to your particular issue. With a limited amount of space you get something important to the viewer even if they aren’t able to take the time to read an email or even a tweet. In this piece created for Everytown for Gun Safety, you can grasp the exact impact of American gun safety with one sentence and a bit of flag imagery.
As we head into the holidays and the new year beyond, organizations are looking for fun and quickly digestible content. Infographics are a fantastic way to create fun or impactful images that people can instantly share. This is the first in a series of blog posts in which we’ll be discussing how to create infographics, and how to use them to create drive action.
Maybe you have great graphics, or some data that needs to be heard and you’re interested in creating some eye catching infographics of your own but don’t know where to start? Shoot us an email at [email protected]. We’d love to chat about how we can go about strengthening your messaging and help your organization’s mission be seen and heard!